This widget displays the scale of the x axis (formatted text values) for a graph corresponding to the associated curve. It is typically used in a table under a graph grid for one or several CURVE_GRAPH objects.
See attributes common to all curve widgets.
See also the PARAM_TEXT specific attributes, since this widget displays text formatted from parameter information.
This widget is deprecated and has been supersed by the RULER widget
| Name | Value Type | Default Value | Description | Comment | V. |
|---|---|---|---|---|---|
|
color |
current text color |
Color of the displayed text. |
|
1.1 |
|
|
text_h_align |
center |
Horizontal alignment of the text. |
This alignment is relative to a regularly spaced grid. See the examples for more details. |
1.1 |
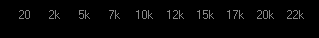
Basic example:
<?xml version="1.0" encoding="utf-8" ?>
<SKIN language_version="1.0" background_color="#000000" v_margin="10" h_margin="10">
   <CURVE_XSCALE text_h_align="center" h_margin="14" height="20" width="300" value_suffix="true"
      curve_id="dsp.output_curve3" color="#888888" value_format=".0" content="{value}" x_positions_count="10"/>
</SKIN>